Among other things, a great Business Analyst should be able to clearly represent business requirements so that every stakeholder can understand them and see how they are involved in the solution to their problems. While there are many, many ways to represent requirements, I found out over time that one of the greatest and easiest ways to do it is simply by using tables.
Just look around you, and you’ll find that tables are everywhere to make your life simplier: mass transit schedules, the TV guide, your music playlist, the nutritional information on almost everything you buy at the grocery store; even baby diapers packages have tables to guide you in selecting the best size for your baby (by the way, I’m so happy to be out of the baby diapers period!).
If they are everywhere, why not using tables when working with business requirements? But don’t go too fast: one does not simply create tables on-the-go to make things clearer. There are a few guidelines that you can follow to make your tables useful; here’s my top 3.
Too much information to share isn’t clearer because it’s in a table format
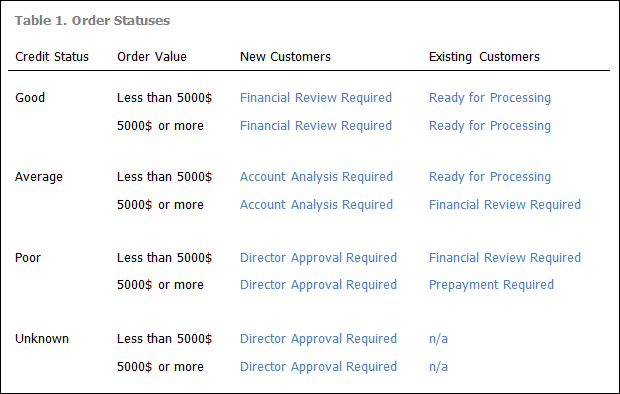
Tables are used to structure information. In order to have a clear structure, you need to first identify which information you want to present; I usually try to limit each of my tables to one specific domain. For example, let’s say I want to present information about the various conditions used to determine the initial status of an order and the order’s items statuses. Even if both statuses can be the same (ex: order is delivered, so are each of its items), I would present these two domains in two separate tables.
Once you’ve done this, another key for creating successful tables is to limit yourself to 1 to 3 dimensions per table. In our previous example, this would mean using only the customer type, the credit status and the value of the order in the order status table. Adding other dimensions (such as the delivery country) could make the whole thing more complex to understand; in this case, it is often easier to create different tables from one dimension and keep both of them under 3 dimensions.
- Table 1: order status for new customers (dimensions: credit status, order value and delivery country)
- Table 2: order status for existing customers (dimensions: credit status, order value and delivery country)
If you have more dimensions, you will need to provide some context to explain how to understand your tables. It might be useful in some complex situations, but otherwise, I would rather use many different tables instead of a bigger one.
Tables mean structure; have one in mind before starting
Everyone love bullet point lists. Heck, I even make lists of lists to stay organized! It is often a good starting point to organize information, but it is not as powerful as tables for multidimensional domains; the same can be said about mindmaps. In our order status example, a simple list could be enough if we only wanted to present available order statuses.
When we try to add additional information to this list (such as conditions leading to each status), it becomes harder to understand. Mindmaps could come to your rescue, but as you add dimensions, they quickly become overloaded. Tables can help you in these situations.
(Before you continue your reading, add to your todo list a review of all your requirements lists, to see if you could convert some of them to tables.)
Formatting can help you… or not
Tables are great (if you’re not convinced yet, go back to the top and read again). However, some Business Analysts can’t resist their urge to use the too many formatting options in Microsoft Word, Excel or PowerPoint on their tables, and they often mess up their nice work at organizing information with tables.
Table formatting should be used to help your readers to understand the information, not help you to show your artistic skills. I came across these table formatting guidelines a few weeks ago, and since they are exactly in line with my thoughts, I’ll just share them with you:
Tables at work with your requirements
There are many good examples of table use for requirements, such as the Seilevel Display-Action-Response model for UI requirements. I could also provide you many professional examples of good tables used to summarize and explain requirements, but I would share too much private information with you. Instead, here’s our order status table example (adapted from some of my work), which shows you what you can do with properly made tables:
Now, go ahead and table-ize your requirements!
Do you like what you’re reading?
Do you have other tips to make tables meaningful for your stakeholders? Other examples of a successful use of tables? Please share with us in the comments below, or in the social medias (Facebook, Twitter, or Google+)!
Credits: kickrjason @ freeimages.com